ABOUT THE DASHBOARD
The Economic Mobility Dashboard is a tool to help partner organizations and community members at large monitor progress toward the three bold goals of the Urban Agenda: increasing median household income, narrowing the gap in wealth accumulation, and decreasing poverty rates for Black and Hispanic/Latino residents of Cleveland and Cuyahoga County. The Dashboard also provides data on various driver indicators that are reasonably assumed to contribute to median income, wealth and poverty and that may offer areas for intervention by partner organizations and other members of the community. These include measures regarding employment, education, digital divide, homeownership, business ownership and family structure, among others.
ECONOMIC MOBILITY INDICATORS
MEDIAN HOUSEHOLD INCOME
WEALTH GAP
POVERTY RATE
The Urban Agenda Economic Mobility Dashboard draws data from the 1-year American Community Survey (ACS) for 2022 to provide a relatively up-to-date snapshot of characteristics across four geographies. The city of Cleveland and Cuyahoga County are our geographies of interest. Data for the state of Ohio and the nation overall are presented for comparison. The ACS comes with certain drawbacks, including a considerable time lag, but its advantages are that it is uniformly administered across geographies and is updated annually. Data from other sources, such as Ohio’s annual school report cards, are used where relevant and reliably updated. The Dashboard, which will be updated annually to incorporate new data, is meant to inform the work of the Urban Agenda, its partnering organizations and the community overall. Indicators included should not be seen as prescribing focus areas for change nor limiting the scope of the Urban Agenda. Components of the Dashboard may evolve and expand as understanding of and progress toward Urban Agenda goals warrant.
DASHBOARD BROWSER RECOMMENDATION – GOOGLE CHROME
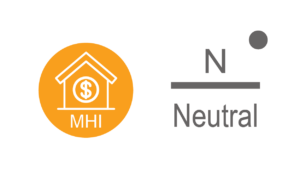
TREND INDICATOR
(Neutral Image Above)
Located in the top right corner of each indicator page. This initial Urban Agenda Dashboard presents a baseline (B) of where population-level indicators of economic mobility stand in Cleveland and Cuyahoga County. Future versions of the Dashboard will mark progress—up, down or neutral—toward achieving income, poverty and wealth goals.
2030 MOBILITY INDICATORS BENCHMARKS OVERVIEW
MEDIAN HOUSEHOLD INCOME 2023 BENCHMARKS
Racial and ethnic disparities in median household income in Cleveland and Cuyahoga County are no greater than the average for the state. In terms of 2022 data, median incomes for Black and Hispanic households in Cleveland would have needed to be $4,000 higher in order for the level of disparity locally to be on par with that seen in the state overall. Median incomes for Black and Brown households would have needed to be roughly $5,200 higher in Cuyahoga County. To keep pace with inflation and typical earnings increases, median incomes for Black and Hispanic/Latino households would need to increase roughly 6% a year to achieve the benchmarks.
WEALTH GAP 2030 BENCHMARKS
Racial and ethnic disparities in net worth in Cleveland and Cuyahoga County are no greater than the average for the nation overall. In terms of 2022 estimates, that would mean increasing the median net worth of Black households in Cuyahoga County by more than $17,000 and Hispanic/Latino households by nearly $24,000.
POVERTY RATE 2030 BENCHMARKS
Racial and ethnic disparities in poverty in Cleveland and Cuyahoga County are no greater than the average for the state overall. Based on 2022 population and income data, that would mean roughly 26,000 fewer Black and Hispanic/Latino residents of Cuyahoga County living in poverty.


